Anantar PowerScope
The Deepest Hardware Monitor for DX340 & DX340Max. Built exclusively for DX340 & DX340Max + Anantar Ultimate — surfacing hardware data that no stock app ever exposes, reading directly from the I2C bus, fuel gauge chips, and Linux sysfs.
PowerScope is DX340 & DX340Max only. It is built specifically for the DX340-family dual-battery hardware, bq25892 / bq24192 charger ICs, and CW2215 / 2217 / 2218 fuel gauges. It is not available for the DX270.
Inside the Hardware
Seven views into data the stock app can never reach — from the live system dashboard down to raw charger registers.
Live System Dashboard
Always-on hardware overview that refreshes in real time — directly from Linux sysfs.
- CPU Usage Gauge — animated circular gauge showing current processor load
- Memory Usage — live used vs. total RAM in GB
- Economy Mode — reduce polling frequency to save battery during casual monitoring
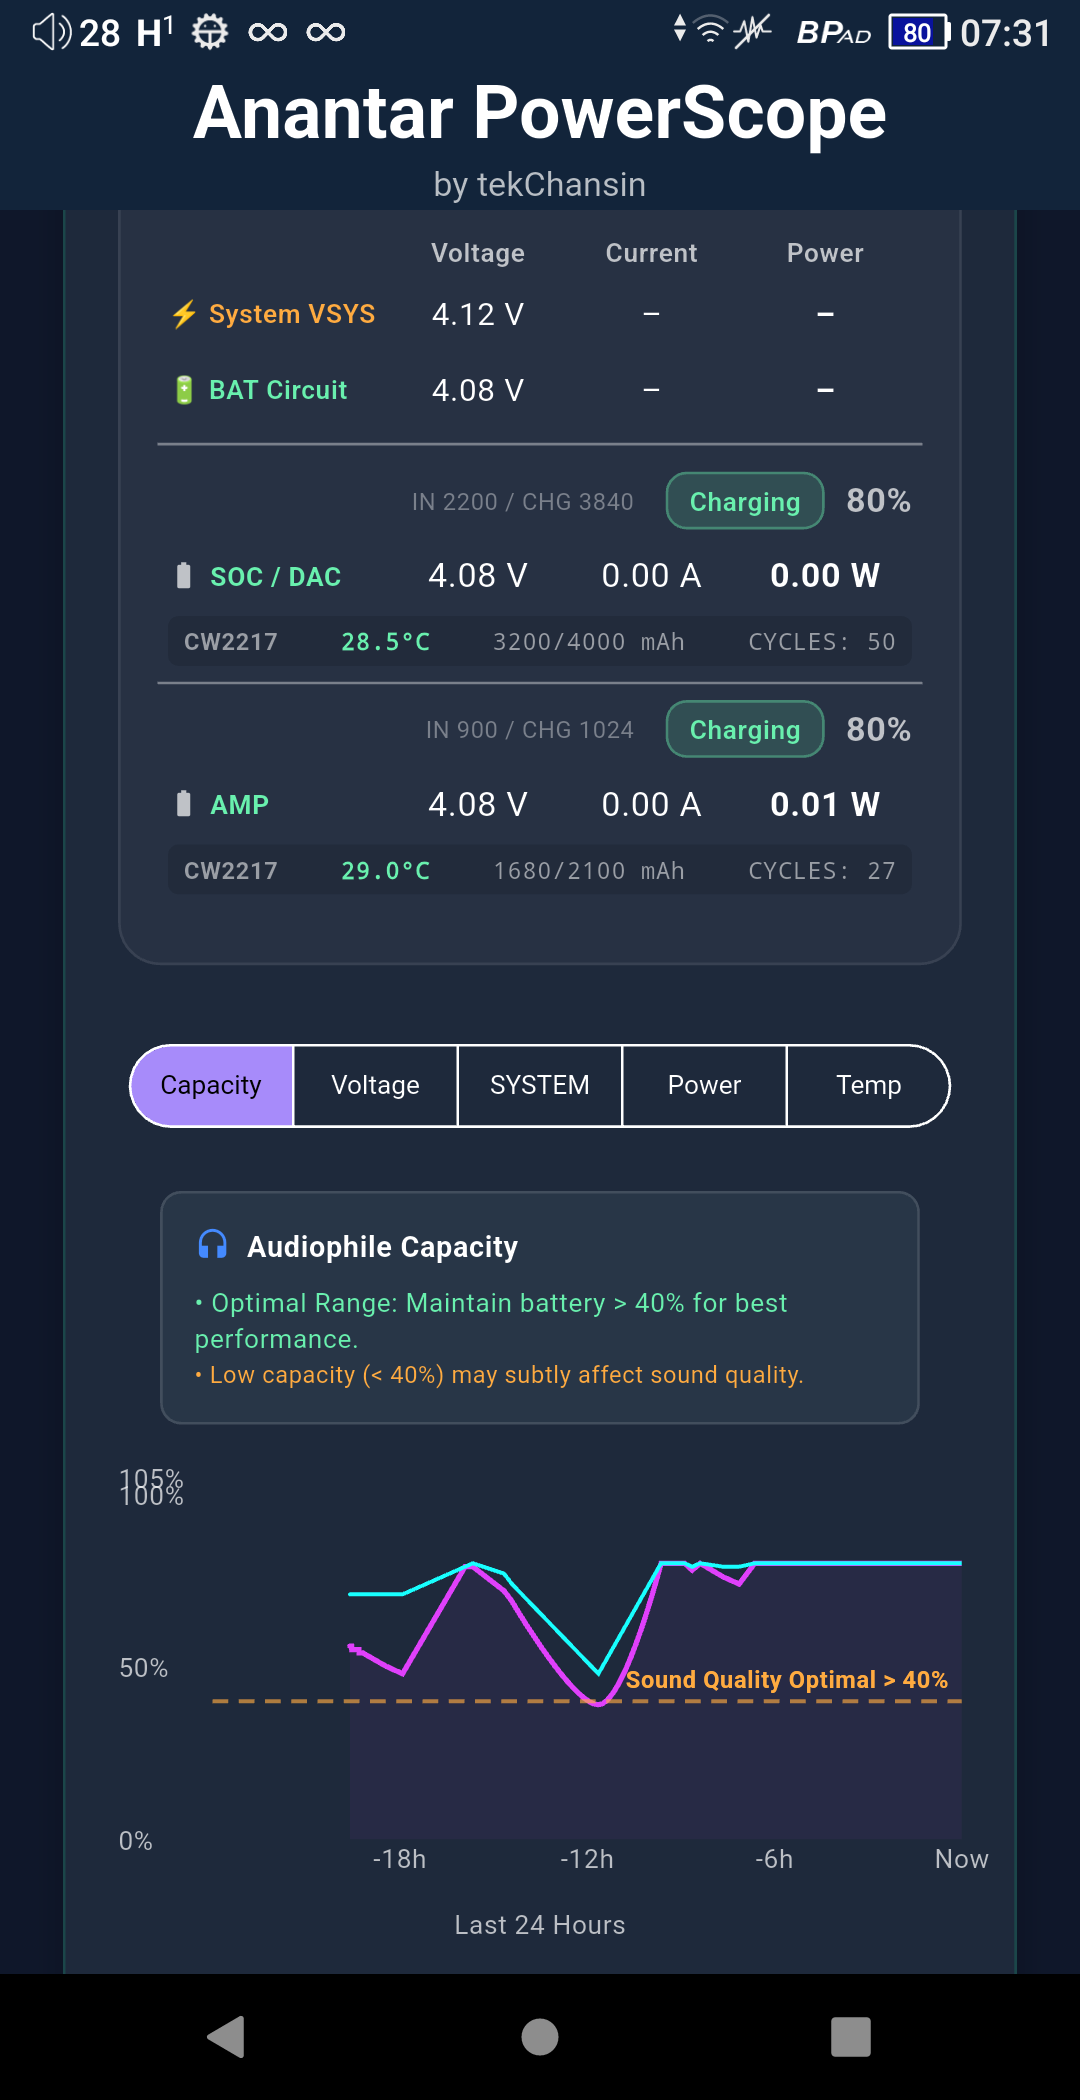
Dual-Battery Monitoring
The DX340 has two separate batteries — SoC and DAC. PowerScope monitors both simultaneously, exposing data no stock app can reach.
- State of Charge — percentage remaining per battery
- Voltage / Current / Power — real-time mV, mA, mW per cell
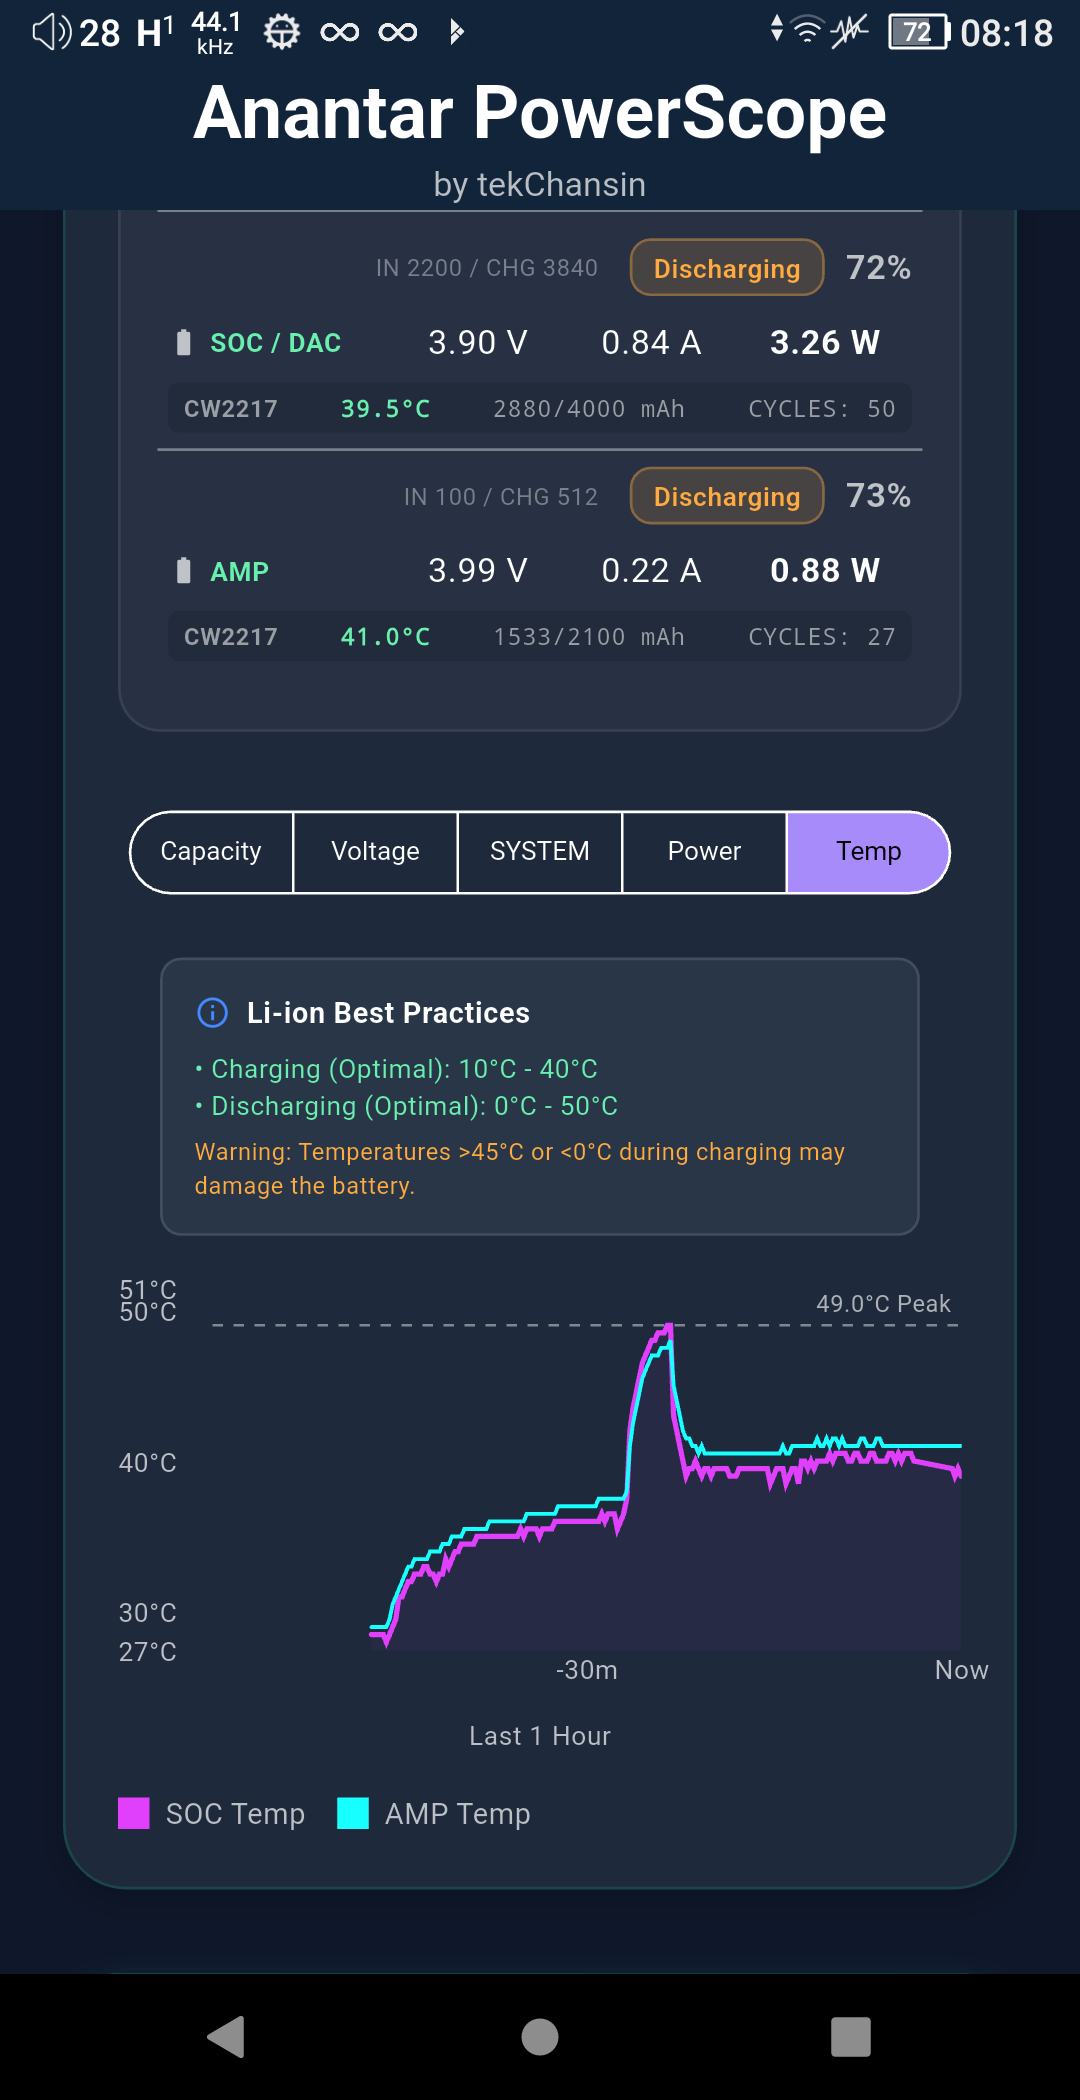
- Temperature — color-coded safety indicator (green / orange / red)
- Health & Charge State — Charging, Discharging, Full, or Bypass
- Capacity (mAh) — design and full-charge capacity
- Charge Cycles — logged by the fuel gauge chip
- Lifetime Min / Max Temperature — recorded by CW2215/2217/2218
Charger Deep Diagnostics
Direct I2C reads from bq25892 (SoC) and bq24192 (DAC) charger ICs — data that is invisible to Android at the OS level.
- VBUS voltage & input current — actual measured vs. limit
- Charger type detection — SDP, CDP, DCP, OTG
- VSYS & battery circuit voltage — system bus stability
- DPM Status — whether the charger is throttling input current
- Fast charge current limit
- Chip ID & register hex — for advanced debugging
Battery History & Charts
Automatic background recording every 15 minutes — building a rolling 24-hour log even when the app is closed.
- Capacity (%) — SOC and DAC charge over time
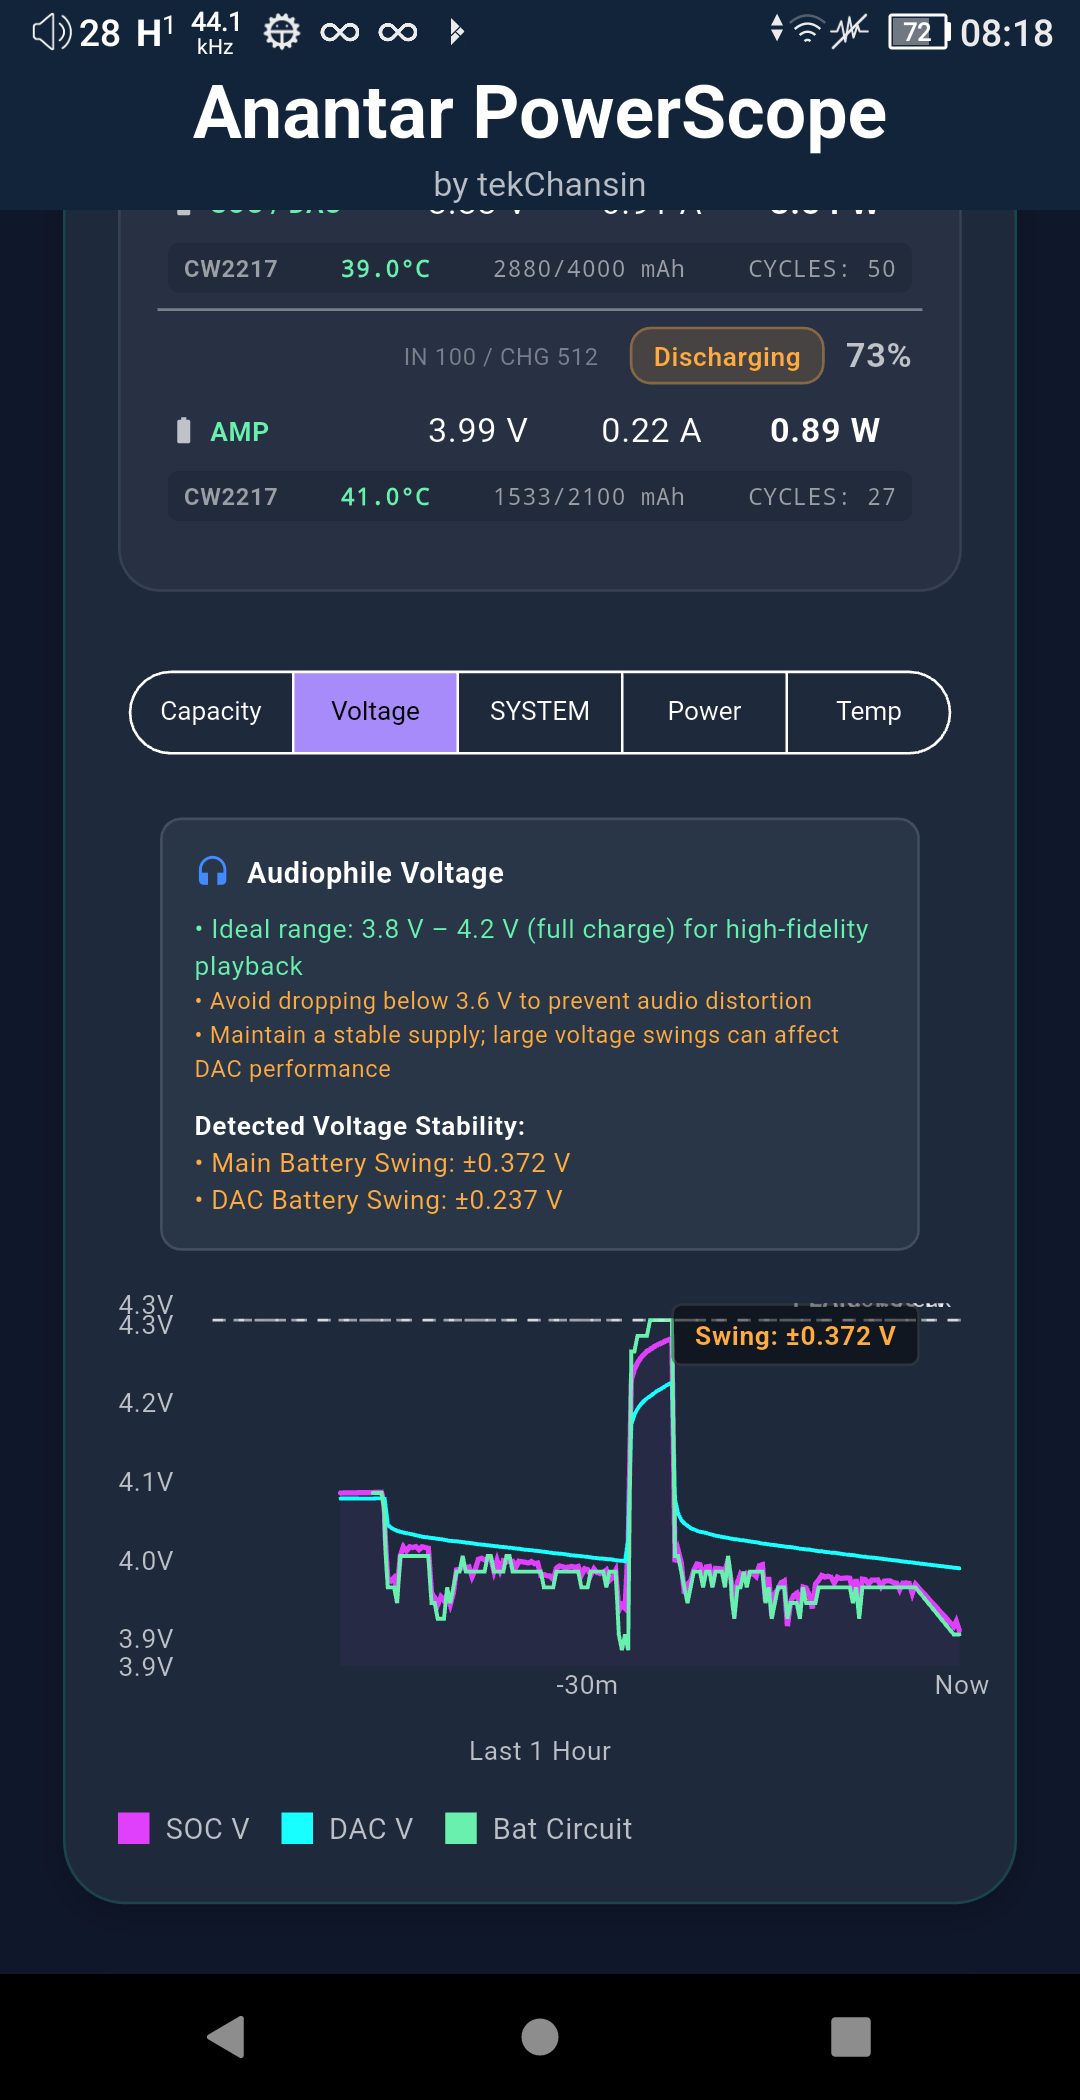
- Voltage (mV) — cell voltages for both batteries
- Power (mW) — SOC, DAC, and USB input power trends
- Temperature (°C) — detect thermal patterns over sessions
- VSYS Voltage — system bus stability history
- Swing Analysis — auto-annotates peak-to-valley voltage difference
- Peak indicators — highest and lowest points marked on each chart
🔒 Stored locally only — no cloud sync, no privacy concerns.
Anantar Configuration Viewer
See every active Anantar and iBasso system property in one place — organized in a clean two-column dashboard. Verify your current Boot Profile, Oversampling Mode, Harmonic Profile, and Infinity Stage at a glance.
OTA Update Tracker
Stay informed about the latest Anantar Ultimate firmware releases without leaving the app.
- Fetches the live OTA manifest from the Anantar update server
- Displays the latest firmware version and changelog summary
- Opens full release notes in the built-in WebView
- Cached locally — available offline
Resources & Community
A dynamic resources section powered by Supabase — curated guides, community forums, and support channels maintained server-side so content stays fresh without an app update. Full offline caching included.